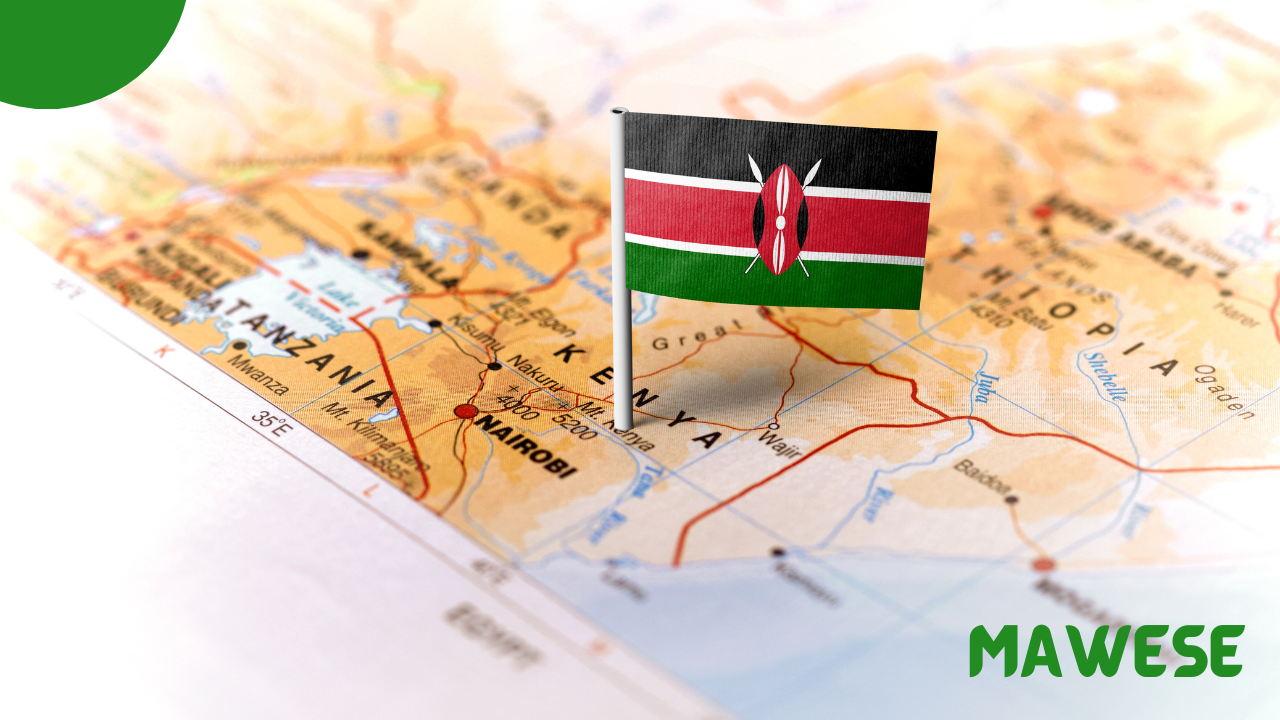
How all the Kenyan counties today were formed can all be tied to the 2010 Kenyan constitution. Before the New constitution was adopted, the Kenyan government structure was tired into Provincial systems whereby the whole country was divided into 8 Provinces as follows:
- Central Province
- Coast Province
- Eastern Province
- Nairobi Province
- North Eastern Province
- Nyanza Province
- Rift Valley Province
- Western Province
However, after 2010 and the First forward to 2013, after the General elections, the 47 county governments that we have today were established, each serving as a semi-devolved state with its own government, with a governor as the head of the executive and a county assembly as the legislative body. Today, all the counties’ formations are based on the boundaries of the former districts, which have been in place since 1992.
As of the writing of this article, all 47 Counties in Kenya have unique features, populations, and even Sizes. The most populous County in Kenya is Nairobi County, with a population of 4,397,073 in 2019, and Turkana is the largest County by land area, with a land area of 98,597.8 kilometres squared. This guide has covered everything you need to know about all the counties in Kenya based on their Sizes and Populations.
All Counties In Kenya By Size (Largest To Smallest)
Below Is A list of the 47 Largest Counties In Kenya arranged by Size:
| S/No | County Code | County | Area (km²) | Capital | Postal Abbreviation |
|---|---|---|---|---|---|
| 1 | 023 | Turkana | 98,597.8 | Lodwar | TRK |
| 2 | 010 | Marsabit | 66,923.1 | Marsabit | MRS |
| 3 | 008 | Wajir | 55,840.6 | Wajir | WJR |
| 4 | 007 | Garissa | 45,720.2 | Garissa | GRS |
| 5 | 004 | Tana River | 35,375.8 | Hola | TRV |
| 6 | 009 | Mandera | 25,797.7 | Mandera | MDR |
| 7 | 011 | Isiolo | 25,336.1 | Isiolo | ISL |
| 8 | 015 | Kitui | 24,385.1 | Kitui | KTU |
| 9 | 025 | Samburu | 20,182.5 | Maralal | SBR |
| 10 | 034 | Kajiado | 21,292.7 | Kajiado | KJD |
| 11 | 033 | Narok | 17,921.2 | Narok | NRK |
| 12 | 006 | Taita-Taveta | 17,083.9 | Wundanyi | TVT |
| 13 | 005 | Lamu | 6,497.7 | Lamu | LMU |
| 14 | 031 | Laikipia | 8,696.1 | Rumuruti | LKP |
| 15 | 024 | West Pokot | 8,418.2 | Kapenguria | WPK |
| 16 | 002 | Kwale | 8,270.3 | Kwale | KWL |
| 17 | 017 | Makueni | 8,008.9 | Wote | MKN |
| 18 | 030 | Baringo | 11,075.3 | Kabarnet | BRG |
| 19 | 003 | Kilifi | 12,245.9 | Kilifi | KLF |
| 20 | 032 | Nakuru | 7,509.5 | Nakuru | NKR |
| 21 | 012 | Meru | 7,003.1 | Meru | MRU |
| 22 | 016 | Machakos | 5,952.9 | Machakos | MCK |
| 23 | 027 | Uasin Gishu | 2,955.3 | Eldoret | UGS |
| 24 | 028 | Elgeyo-Marakwet | 3,049.7 | Iten | EMK |
| 25 | 029 | Nandi | 2,884.5 | Kapsabet | NDI |
| 26 | 018 | Nyandarua | 3,107.7 | Ol Kalou | NDR |
| 27 | 026 | Trans-Nzoia | 2,469.9 | Kitale | TNZ |
| 28 | 037 | Kakamega | 3,033.8 | Kakamega | KKG |
| 29 | 013 | Tharaka-Nithi | 2,609.5 | Kathwana | TNT |
| 30 | 014 | Embu | 2,555.9 | Embu | EMB |
| 31 | 039 | Bungoma | 2,206.9 | Bungoma | BGM |
| 32 | 019 | Nyeri | 2,361.0 | Nyeri | NYR |
| 33 | 043 | Homa Bay | 3,154.7 | Homa Bay | HBY |
| 34 | 044 | Migori | 2,586.4 | Migori | MGR |
| 35 | 041 | Siaya | 2,496.1 | Siaya | SYA |
| 36 | 042 | Kisumu | 2,009.5 | Kisumu | KSM |
| 37 | 022 | Kiambu | 2,449.2 | Kiambu | KMB |
| 38 | 021 | Murang’a | 2,325.8 | Murang’a | MRG |
| 39 | 040 | Busia | 1,628.4 | Busia | BSA |
| 40 | 020 | Kirinyaga | 1,205.4 | Kerugoya | KRG |
| 41 | 035 | Kericho | 2,454.5 | Kericho | KRC |
| 42 | 036 | Bomet | 1,997.9 | Bomet | BMT |
| 43 | 045 | Kisii | 1,317.9 | Kisii | KSI |
| 44 | 038 | Vihiga | 531.3 | Mbale | VHG |
| 45 | 046 | Nyamira | 912.5 | Nyamira | NMR |
| 46 | 001 | Mombasa | 212.5 | Mombasa | MSA |
| 47 | 047 | Nairobi | 694.9 | Nairobi | NBI |
All Counties In Kenya by Population( Largest To Smallest)
Kenya’s population is determined by the Kenya Population and Housing Census (KPHC), which is done after 10 years. The last census was in August 2019 and was the first paperless census in Kenya. According to the 2019 census data, the total population of Kenya was 47,564,296, with 23,548,056 males, 24,014,716 females, and 1,524 intersex individuals.
Below is a table of all the 47 counties by population arranged from largest in number to smallest:
| S/No | County Code | County | Population (2019 Census) | Capital | Postal Abbreviation |
|---|---|---|---|---|---|
| 1 | 047 | Nairobi | 4,397,073 | Nairobi | NBI |
| 2 | 022 | Kiambu | 2,417,735 | Kiambu | KMB |
| 3 | 032 | Nakuru | 2,162,202 | Nakuru | NKR |
| 4 | 037 | Kakamega | 1,867,579 | Kakamega | KKG |
| 5 | 039 | Bungoma | 1,670,570 | Bungoma | BGM |
| 6 | 003 | Kilifi | 1,453,787 | Kilifi | KLF |
| 7 | 016 | Machakos | 1,421,932 | Machakos | MCK |
| 8 | 023 | Turkana | 1,504,976 | Lodwar | TRK |
| 9 | 012 | Meru | 1,545,714 | Meru | MRU |
| 10 | 045 | Kisii | 1,266,860 | Kisii | KSI |
| 11 | 033 | Narok | 1,157,873 | Narok | NRK |
| 12 | 042 | Kisumu | 1,155,574 | Kisumu | KSM |
| 13 | 043 | Homa Bay | 1,131,950 | Homa Bay | HBY |
| 14 | 044 | Migori | 1,116,436 | Migori | MGR |
| 15 | 034 | Kajiado | 1,117,640 | Kajiado | KJD |
| 16 | 015 | Kitui | 1,136,187 | Kitui | KTU |
| 17 | 027 | Uasin Gishu | 1,163,186 | Eldoret | UGS |
| 18 | 026 | Trans-Nzoia | 990,341 | Kitale | TNZ |
| 19 | 040 | Busia | 893,681 | Busia | BSA |
| 20 | 009 | Mandera | 867,457 | Mandera | MDR |
| 21 | 041 | Siaya | 993,183 | Siaya | SYA |
| 22 | 035 | Kericho | 901,777 | Kericho | KRC |
| 23 | 036 | Bomet | 875,689 | Bomet | BMT |
| 24 | 029 | Nandi | 885,711 | Kapsabet | NDI |
| 25 | 017 | Makueni | 987,653 | Wote | MKN |
| 26 | 007 | Garissa | 841,353 | Garissa | GRS |
| 27 | 008 | Wajir | 781,263 | Wajir | WJR |
| 28 | 019 | Nyeri | 759,164 | Nyeri | NYR |
| 29 | 014 | Embu | 608,599 | Embu | EMB |
| 30 | 021 | Murang’a | 1,056,640 | Murang’a | MRG |
| 31 | 024 | West Pokot | 621,241 | Kapenguria | WPK |
| 32 | 046 | Nyamira | 605,576 | Nyamira | NMR |
| 33 | 020 | Kirinyaga | 610,411 | Kerugoya | KRG |
| 34 | 018 | Nyandarua | 638,289 | Ol Kalou | NDR |
| 35 | 038 | Vihiga | 590,013 | Mbale | VHG |
| 36 | 013 | Tharaka-Nithi | 393,177 | Kathwana | TNT |
| 37 | 030 | Baringo | 666,763 | Kabarnet | BRG |
| 38 | 028 | Elgeyo-Marakwet | 454,480 | Iten | EMK |
| 39 | 006 | Taita-Taveta | 340,671 | Wundanyi | TVT |
| 40 | 011 | Isiolo | 268,002 | Isiolo | ISL |
| 41 | 031 | Laikipia | 518,560 | Rumuruti | LKP |
| 42 | 010 | Marsabit | 459,785 | Marsabit | MRS |
| 43 | 002 | Kwale | 866,820 | Kwale | KWL |
| 44 | 004 | Tana River | 315,943 | Hola | TRV |
| 45 | 025 | Samburu | 310,327 | Maralal | SBR |
| 46 | 005 | Lamu | 143,920 | Lamu | LMU |
| 47 | 001 | Mombasa | 1,208,333 | Mombasa | MSA |
Questions And Answers
What is the population of Kenya in 2025?
The current population of Kenya is 57,238,508 as of 2025 based on data from Worldometer
Which county is 001 in Kenya?
| Mombasa (County) |
What is the population of each county in Kenya?
Based on the 2019 Census the Population of each County in Kenya is as follows:
- Nairobi – 4,397,073
- Kiambu – 2,417,735
- Nakuru – 2,162,202
- Kakamega – 1,867,579
- Bungoma – 1,670,570
- Kilifi – 1,453,787
- Machakos – 1,421,932
- Turkana – 1,504,976
- Meru – 1,545,714
- Kisii – 1,266,860
- Narok – 1,157,873
- Kisumu – 1,155,574
- Homa Bay – 1,131,950
- Migori – 1,116,436
- Kajiado – 1,117,640
- Kitui – 1,136,187
- Uasin Gishu – 1,163,186
- Trans-Nzoia – 990,341
- Busia – 893,681
- Mandera – 867,457
- Siaya – 993,183
- Kericho – 901,777
- Bomet – 875,689
- Nandi – 885,711
- Makueni – 987,653
- Garissa – 841,353
- Wajir – 781,263
- Nyeri – 759,164
- Embu – 608,599
- Murang’a – 1,056,640
- West Pokot – 621,241
- Nyamira – 605,576
- Kirinyaga – 610,411
- Nyandarua – 638,289
- Vihiga – 590,013
- Tharaka-Nithi – 393,177
- Baringo – 666,763
- Elgeyo-Marakwet – 454,480
- Taita-Taveta – 340,671
- Isiolo – 268,002
- Laikipia – 518,560
- Marsabit – 459,785
- Kwale – 866,820
- Tana River – 315,943
- Samburu – 310,327
- Lamu – 143,920
- Mombasa – 1,208,333
What is the fastest-growing county in Kenya?
Marsabit is the fastest-growing county economy in Kenya between 2019 and 2023 with an average growth rate of 9.3%
What is the population of Nakuru in 2025?
453,000


